

Prioritize KPIs by funnel stage, not by which numbers look biggest. Viewability and view rate gauge whether anyone actually saw the ad; engaged-view conversions and click conversions gauge whether they acted; conversions, CPA, and ROAS gauge whether it paid off. Brand Lift and platform-native metrics sit in a separate diagnostic lane, useful, but never a substitute for the funnel-based core.
TL;DR:
- Focusing on viewability and view rate is essential to measure if ads are seen, while engagement and outcome metrics reveal whether viewers act or convert.
- Different platforms use distinct definitions for "view," making cross-platform comparisons unreliable without proper segmentation and standardization.
- Pair one attention metric with one outcome metric in each campaign to accurately diagnose whether views translate into business results.
- Prioritize KPIs based on campaign stage, selecting specific metrics like viewable rate for awareness, VTR for consideration, and ROAS for conversions.
- Regularly review creative performance by testing multiple hook variants and refreshing creative every 7 to 14 days to optimize viewer retention and campaign results.
Table of Contents
- Video Ad KPIs by Funnel Stage: Definitions and Formulas
- Platform Reporting Differences You Need to Account For
- How to Choose the Right KPI Mix for a Campaign
- Reading the Report Without Getting Fooled
- What Producers Need to Know to Move These Numbers
- How I Actually Run This Cadence With Clients
- How Helps Agencies Turn KPI Diagnostics Into Better Creative
- Sources
Video Ad KPIs by Funnel Stage: Definitions and Formulas
Every video ad KPI answers a question tied to one funnel stage: did people see it, did they pay attention, and did it move them to act. Mixing those questions up is how marketing teams end up celebrating a viral view count while conversions stay flat.
Awareness metrics: did anyone actually see it?
Impressions count every time your ad loads, whether or not it was seen. Reach counts unique people exposed. CPM (cost per thousand impressions) tells you what raw exposure costs, but it says nothing about whether the ad had a chance to register.
That's where viewability comes in. Google's Active View standard defines a viewable impression as at least 50% of the ad's pixels on screen for a minimum of 2 continuous seconds. Only impressions that were technically measurable count toward this rate, which is why the denominator matters: viewable rate = viewable impressions ÷ measurable impressions, not viewable impressions ÷ total impressions. A campaign can report millions of impressions and still have a mediocre viewable rate if half of them never had a real chance to be seen.
Engagement metrics: did they pay attention?
View rate (VTR) measures how many people who saw the ad watched it, typically expressed as views divided by impressions. Hook rate, sometimes called 3 second rate, isolates the earliest and most brutal test: did the first few seconds stop the scroll? Quartile completion (25%, 50%, 75%, 100%) shows exactly where attention drops off, and average watch time gives you a single number to track that trend over time.
Outcome metrics: did it drive a result?
Clicks and CTR measure direct response. Conversion rate, CPA (cost per acquisition), and ROAS (return on ad spend) measure whether those clicks or views turned into revenue. Revenue-per-conversion rounds this out by telling you if the conversions you're buying are worth what you're paying for them.
Google Ads also tracks engaged-view conversions, which count when someone watches at least 10 seconds of a skippable in-stream ad, or 5 seconds of an in-feed or Shorts ad, and then converts within your set conversion window, even without clicking. This is a real signal of ad influence, distinct from a click conversion, and it's often the metric that explains a discrepancy between "low CTR" and "the sales team says this campaign is working."
Recommended KPI bundles by objective
- Prospecting/awareness: measurable impressions, viewable rate, reach, CPM, hook rate
- Mid-funnel/consideration: VTR, quartile completion, average watch time, engaged-view conversions
- Direct response/conversion: CTR, conversion rate, CPA, ROAS, revenue-per-conversion
Pro Tip: Pair one attention metric with one outcome metric for every campaign you run. A high view rate with no conversion tracking tells you people watched, not whether it mattered to your business. This pairing habit is the single biggest fix for wasted spend from vanity-metric optimization, and it costs nothing to implement beyond checking two numbers instead of one.
Platform Reporting Differences You Need to Account For
The same word, "view," means different things depending on where your ad runs, and treating them as interchangeable is how cross-platform reports become useless.
On YouTube, a TrueView view registers once someone watches 30 seconds or the full ad, whichever comes first, or clicks on it. Google's own guidance flags an important distinction: Ads data and organic data are tracked separately, and linking your YouTube channel to Google Ads is what unlocks full video analytics, including audience retention curves and engaged-view conversion reporting. Skip that link and you're reading a partial picture. The difference between public view counts and ad view counts also explains why a video can show huge organic view totals on its public page while the Ads dashboard shows something far more modest for the paid portion.
Viewability itself is measured against the Active View standard everywhere Google reports it, which is why the denominator issue matters twice as much across platforms: always confirm whether a report is dividing by measurable impressions or total impressions before comparing rates.
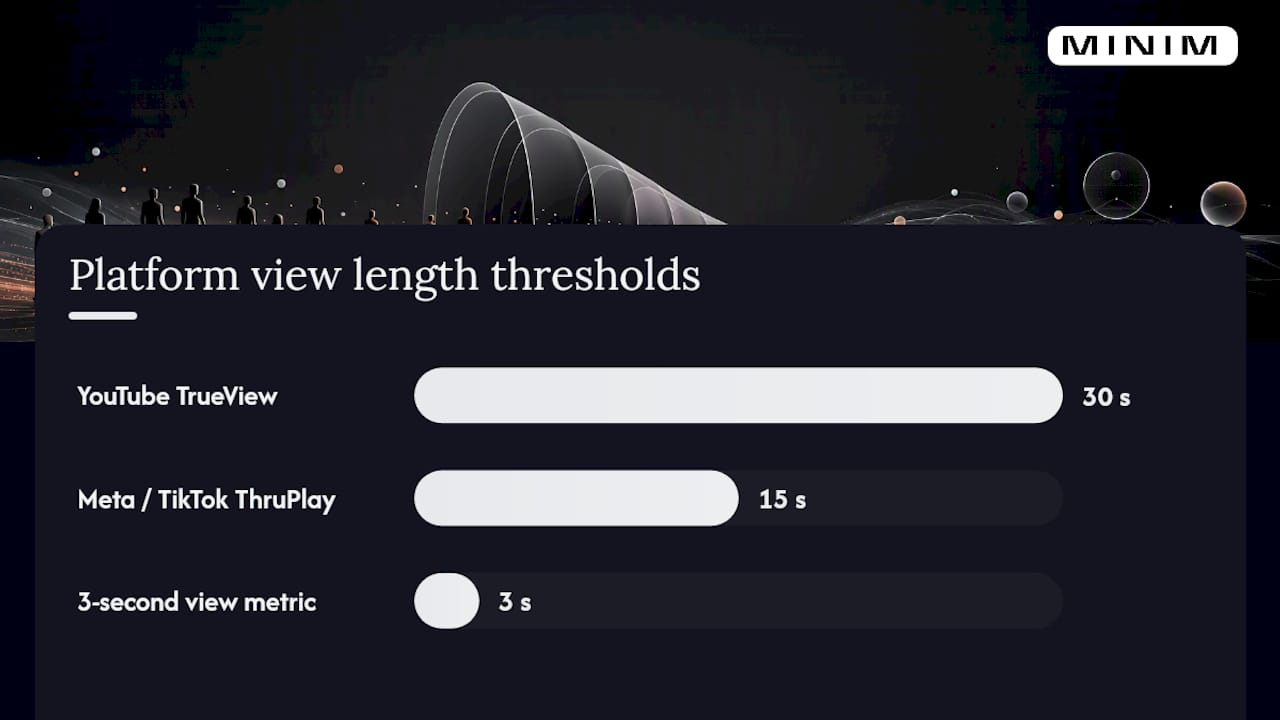
Meta and TikTok use their own shorthand. ThruPlay counts a video played to completion or for 15 seconds. Hook and hold metrics on these platforms approximate VTR and quartile retention but aren't calculated identically, so a "hook rate" on TikTok and a "3 second view rate" on YouTube are cousins, not twins.
Three rules keep cross-platform reporting honest:
- Compare equivalent metrics only. Don't set a TikTok ThruPlay rate against a YouTube completion rate and call it apples to apples.
- Segment reports by ad event type before drawing conclusions. Skippable in-stream, non-skippable, and in-feed placements all count differently.
- Host on YouTube when full-funnel visibility matters more than platform-native reach, since that's where Google's deepest reporting layer lives.
How to Choose the Right KPI Mix for a Campaign
Start by mapping your campaign objective to a funnel stage, then pick one primary KPI and two or three diagnostics from a trusted digital marketing agency. That's it. Resist the urge to track everything the platform offers.
- Identify the objective. Are you buying attention, building consideration, or driving a direct action?
- Pick one primary KPI. For awareness, that's viewable rate. For consideration, it's VTR or engaged-view conversions. For direct response, it's ROAS or CPA.
- Add two or three diagnostics. These explain why the primary number moves. Quartile completion and hook rate diagnose attention; CTR and conversion rate diagnose action.
- Cap your active KPI list at 5 to 7. Past that, you're generating reports instead of making decisions.
- Always include one outcome metric. Even a pure branding campaign should track something downstream, whether that's site visits, search lift, or Brand Lift results.
A prospecting campaign might run on measurable impressions, viewable rate, hook rate, CPM, and reach. A consideration campaign runs on VTR, quartile completion, average watch time, and engaged-view conversions. A conversion campaign runs on CTR, conversion rate, CPA, and ROAS, with viewable rate kept as a sanity check rather than a headline number.
Reading the Report Without Getting Fooled
Read video ad reports in a fixed order: measurable impressions and viewability first, then attention (VTR and quartiles), then action (engaged-view or click conversions), and only then brand outcomes like Brand Lift, which belongs in a separate lane for measuring perception rather than direct response. Skipping straight to conversions without checking whether the ad was even viewable is how teams misdiagnose a targeting problem as a creative problem.
Three misreads show up constantly:
- High VTR, low conversions. Usually a targeting or offer mismatch, not a creative failure, since people are clearly willing to watch.
- Inflated public view counts vs. Ads view counts. Organic and paid views are tracked separately, so don't cite the video's total YouTube view count in a paid performance report.
- Cross-platform attribution mismatches. Different platforms use different conversion windows and counting methods, which inflates or deflates totals depending on where you're looking.
The fix is almost always the same: segment by ad event type, double check your conversion window settings, and lean on server-side tracking or marketing mix modeling when platform-reported numbers stop making sense against actual revenue.
What Producers Need to Know to Move These Numbers
Hook rate lives or dies in the first 1 to 3 seconds. Pattern interrupts, unexpected visuals, and text on screen in that opening window do more for attention metrics than anything in the middle of the edit.
- Commission at least three hook variants per concept, not one
- Request modular 3 second and 15 second edits from the same creative brief so you can test without reshooting
- Localize the master edit rather than translating it after the fact to protect hook performance across markets
- Refresh creative on a fixed cadence, since fatigue quietly erodes VTR and ROAS before anyone notices in the topline numbers
Pro Tip: Ask your production partner for a retention curve export on every variant. It shows exactly where viewers dropped, which turns "the ad underperformed" into "viewers left at second four," a fixable brief note instead of a mystery.
How I Actually Run This Cadence With Clients
Every campaign I've watched succeed follows the same rhythm: launch two or three creative variants, check viewability and hook rate within the first week, then decide whether the problem is attention or conversion before touching the media budget. Refresh underperforming variants every 7 to 14 days on active spend, and never scale a winner past two weeks without a fresh comparison running alongside it.
— Steven Reina
How Helps Agencies Turn KPI Diagnostics Into Better Creative
Diagnosing a weak hook rate or a flat ROAS is only useful if you can act on it fast, and that's a challenge agencies face. Integration with creative teams can produce modular variants, localized masters, and rapid retests that KPI diagnostics call for, without adding headcount.

A campaign that's losing viewers at the 3 second mark doesn't need a new media plan. It needs a new opening 3 seconds, tested against the original, delivered fast enough to matter before the flight ends. That's the kind of turnaround built into how MINIM structures production and campaign services, from screenwriting through 2D/3D and final delivery. If your reports keep showing the same hook rate ceiling campaign after campaign, that's a production brief problem, not a targeting problem, and it's worth a conversation about your next campaign before you spend another cycle guessing at the fix.